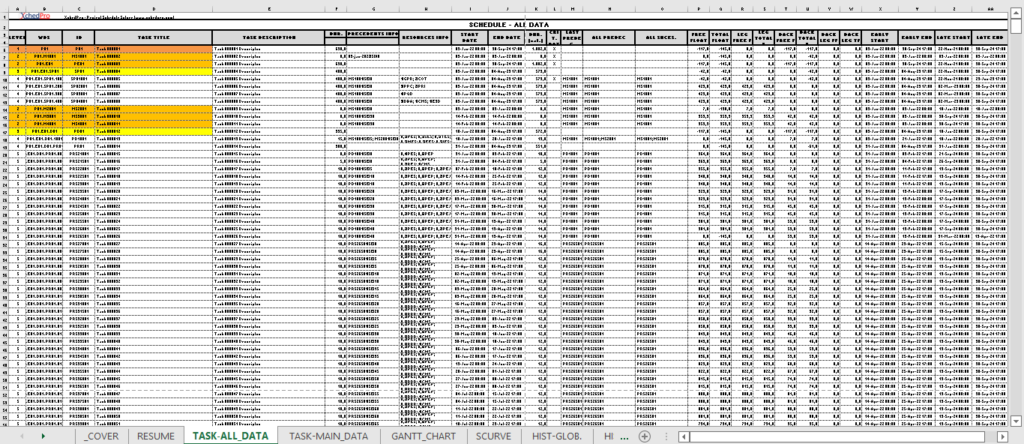
MS Excel files are used for data input and output.
This is very useful to generate input data for large and complex schedules and allow a great flexibility to customize reports from output data.
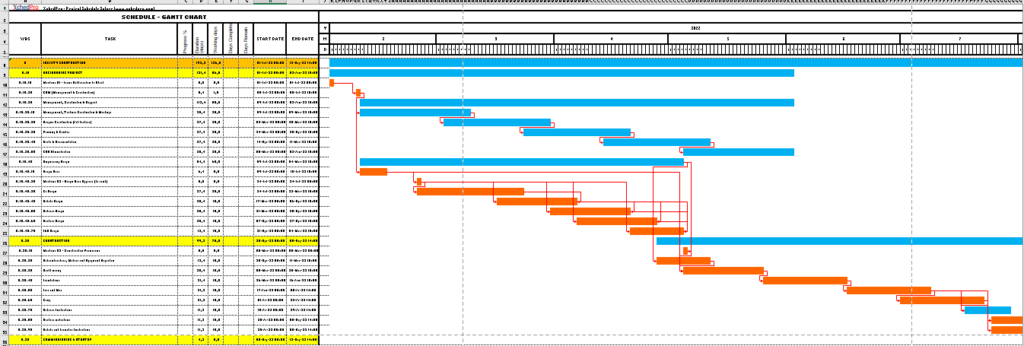
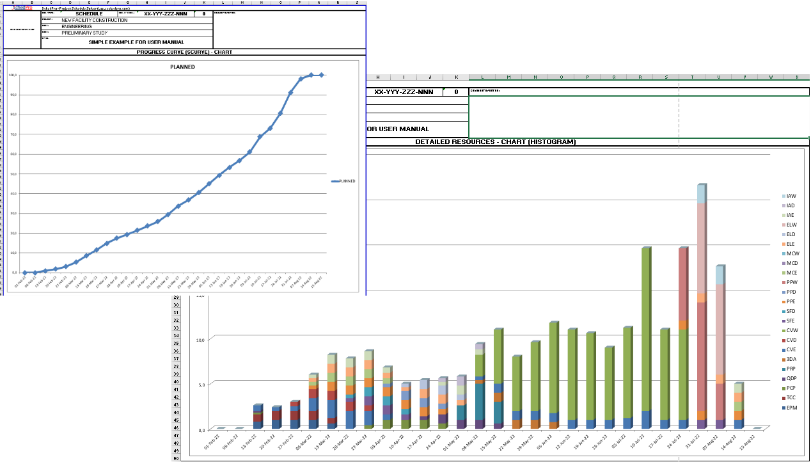
The MS Excel output files include several pre-configured reports, such as Gantt charts, Progress Curve (S Curve) charts, and Resource Histogram charts.
Additional detailed results are also available in tabular format, allowing for easy customization of specific reports in MS Excel or other software. Advanced users can utilize this data to perform additional data analysis and/or create tailor made dynamic dashboards with AI customized prompts, MS Power BI or similar tools.
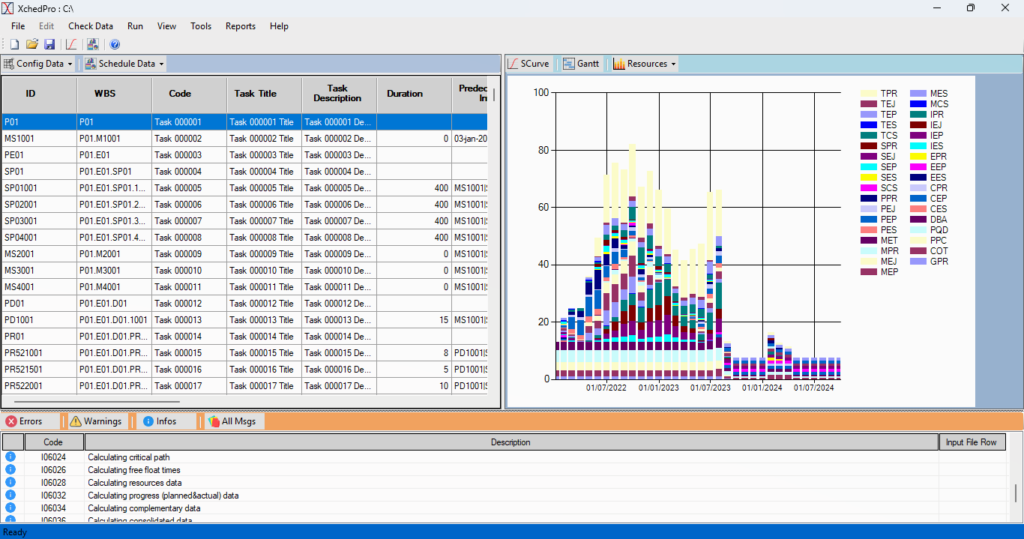
Interactive Graphical User Interface
The XchedPro graphical user interface (GUI) enables users to quickly create new schedules, edit existing ones, perform calculations, and visualize results—all in a fast and iterative workflow. It also conducts a detailed analysis of input data, detecting errors and inconsistencies before calculations are executed to guarantee reliable outcomes.